Did you know a car accident occurs every 13 minutes in the United States?
When you think about road safety, do you ever wonder how many accidents happen daily and why? Auto accidents not only impact lives but also drive demand for repairs, insurance claims, and safety innovations.
Let’s dive into the trends, supported by eye-opening statistics, to uncover insights that matter to your auto repair business.
Quick car accident statistics
To set the stage, here are some fast facts:
- The average person will likely crash their car 3-4 times in a lifetime.
- Over 50% of car accidents occur within 5 miles of home.
- Talking on the phone while driving increases your chances of an accident by 400%.
- Car accidents are the leading cause of death in children under 15 in the U.S.
- On average, a pedestrian dies from a car crash every 88 minutes in the U.S.
Total number of car accidents per year in the U.S.
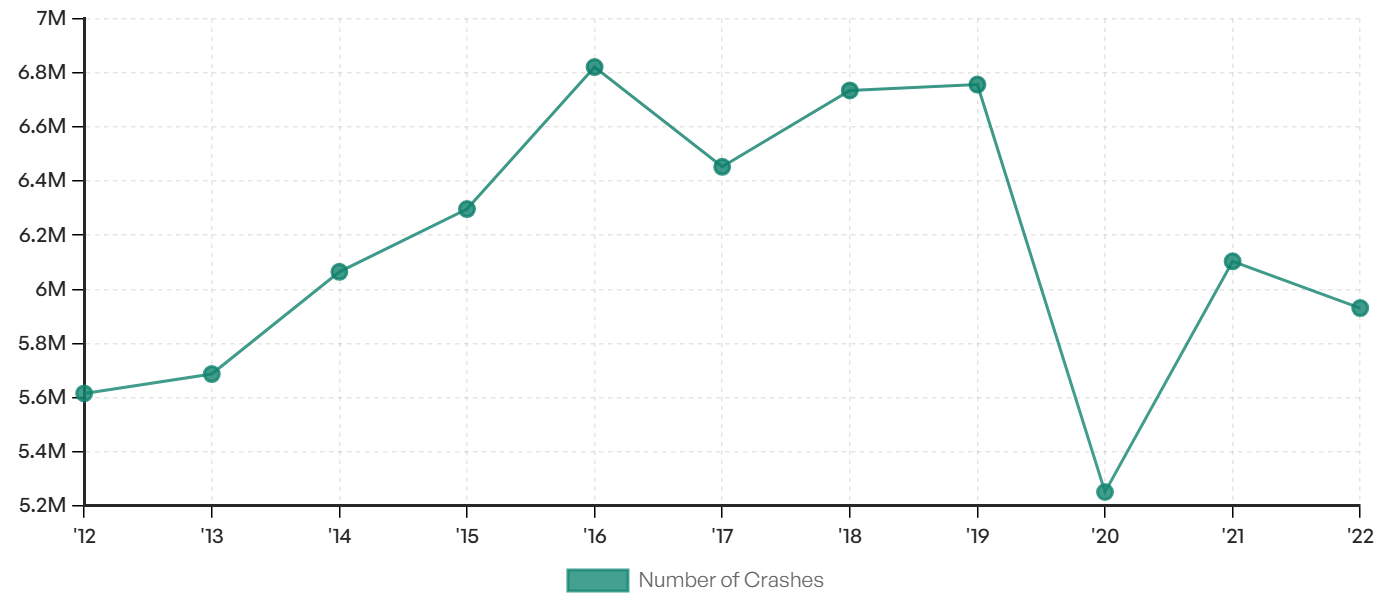
In December 2022, there were over 284 million vehicles on U.S. roads, with a projected 243.4 million licensed drivers in 2023. Despite this, there are over 6 million passenger car accidents annually, leading to more than 38,000 fatalities each year.
However, preliminary data from the NHTSA brings hopeful news: an estimated 18,720 lives were lost in traffic crashes between January and June 2024—a 3.2% drop from the 19,330 fatalities during the same period in 2023.
While fatality rates declined, Americans were on the move, logging 1.81 billion more miles (a modest 0.08% increase). This combination led to a significant improvement in safety, with the projected fatality rate dropping from 1.21 deaths per 100 million miles traveled in 2023 to 1.17 deaths per 100 million miles in 2024.
A small but meaningful step towards safer roads!
U.S. states with the most car accidents
The latest NHTSA data reveals the states with the highest motor vehicle fatality rates per 100,000 residents. Mississippi leads the list with the highest rate, followed by Alabama, Wyoming, and South Carolina.
These states face unique challenges that contribute to elevated traffic fatalities, including rural road conditions, higher driving speeds, and limited emergency services. Addressing these issues could pave the way for solutions like better road infrastructure, safer driving campaigns, and improved emergency response systems.
Here’s a closer look at the data:
Rank | State | Deaths Per 100,000 |
1 | Mississippi | 25.4 |
2 | Alabama | 21.5 |
3 | Wyoming | 19.6 |
4 | South Carolina | 19.4 |
5 | New Mexico | 18.4 |
6 | Montana | 18.2 |
7 | Louisiana | 17.5 |
8 | Arkansas | 17.2 |
9 | Kentucky | 16.7 |
10 | Missouri | 16.4 |
Pedestrian and cyclist accidents
Early estimates from the National Highway Traffic Safety Administration (NHTSA) show that pedestrian, bicyclist, and overall traffic fatalities dropped in the first half of 2024 compared to the same period last year.
- Pedestrian deaths fell by 3%.
- Cyclist deaths dropped by 1%.
Additionally, the fatality rate improved, dropping from 1.21 deaths per 100 million vehicle miles traveled in the first half of 2023 to 1.17 in 2024.

Gender trends in U.S. car fatalities
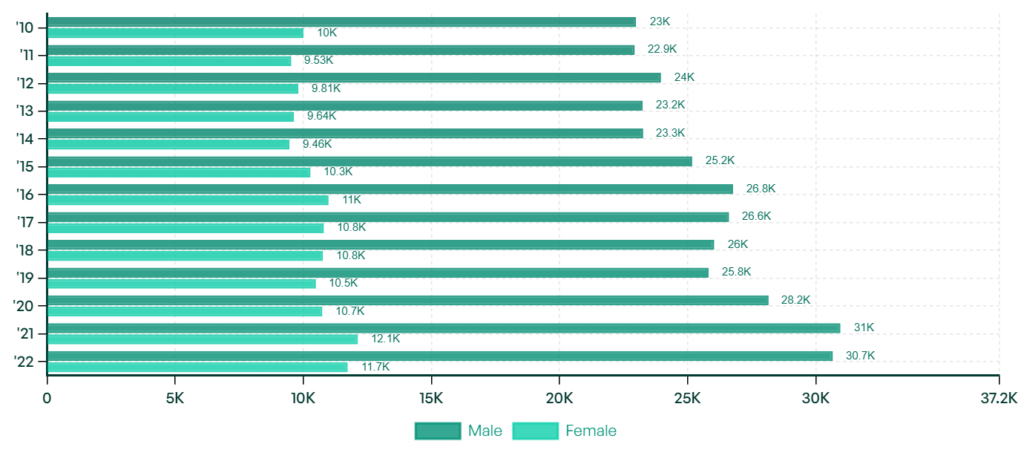
From 2010 to 2022, more men were involved in fatal crashes than women, with male fatalities ranging from 23,000 to 30,700 annually, compared to 10,000 to 11,700 for women. Men are also three times more likely to be involved in fatal crashes than women—a gap that reflects not only the higher number of male drivers but also differences in driving habits, including riskier behaviors.
Age is another critical factor. Young drivers aged 16-20 have the highest fatal crash rates, with 34 deaths per 100,000 licensed drivers. For teens, inexperience and nighttime driving are leading contributors to these alarming numbers.
Car fatalities by vehicle type
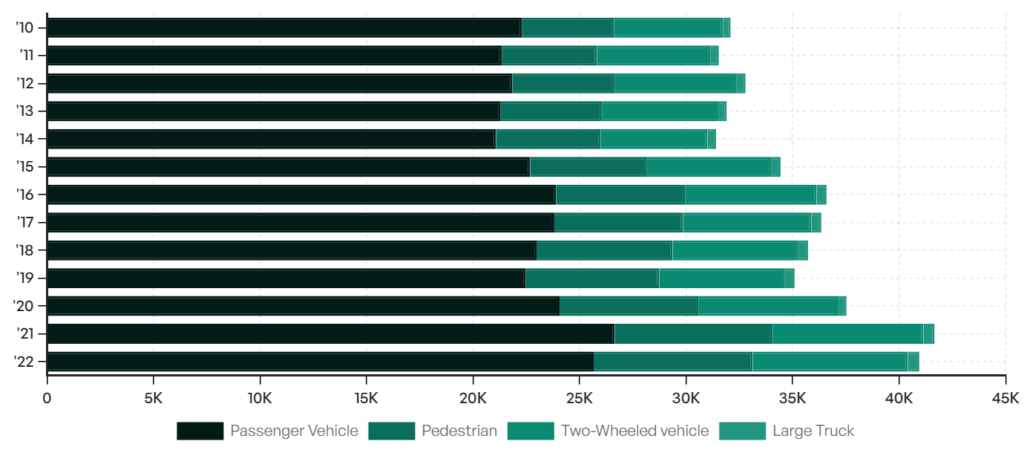
The latest data from the Insurance Institute for Highway Safety (IIHS) highlights the number of lives lost each year in car accidents, broken down by vehicle type.
In 2022, the most recent year for which data is available, the numbers were as follows:
- 25,700 fatalities in passenger vehicles
- 7,470 pedestrians
- 7,290 motorcyclists and other two-wheelers
- 533 involving large trucks
Passenger vehicles account for the largest number of fatalities, likely due to their widespread use. However, pedestrians and motorcyclists face much higher risks, as they have less protection in crashes. While accidents involving large trucks are less frequent, they often result in more severe outcomes due to the size and weight of the vehicles involved.
7 major causes of auto accidents
Speeding
Speeding is the top cause of accidents in the U.S. When you exceed the speed limit, you have less time to react to sudden dangers and are more likely to lose control, especially in bad weather.
In fact, speeding was responsible for 29% of all fatal accidents in 2022, which means about 33 people lost their lives every day because of it.
While speeding happens across all age groups, young drivers are the most at risk. 40% of speeding drivers involved in fatal crashes were between the ages of 16 and 24. And it’s no surprise that most people agree: 47% believe speeding is the leading cause of accidents.
Distracted Driving
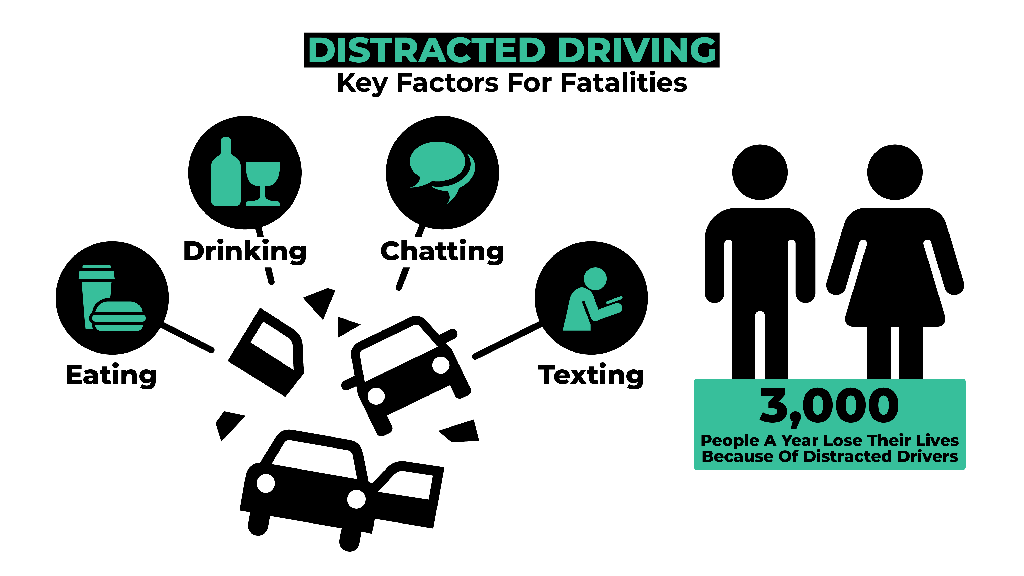
Distracted driving is any activity that takes your focus off the road. Whether it’s texting, eating, or talking on the phone, it’s a huge danger.
It’s shocking to think about how many drivers multitask behind the wheel. Around 3,000 people die every year due to distracted driving, and that number keeps rising. It’s a serious issue we can’t ignore.
Drowsy Driving
Drowsy driving happens when you’re too tired to focus, and in the worst cases, it can cause you to fall asleep at the wheel. Experts say driving while drowsy is just as dangerous as driving drunk because your reaction time slows down, and you can miss potential dangers.
In 2017, over 91,000 crashes involved drivers who were too tired to stay awake. So, if you’re feeling drowsy, it’s best to pull over and take a break. It could save your life.
Running Red Lights
Running red lights is not just illegal – it’s incredibly dangerous. When you don’t stop at a red light, you’re putting yourself and others at serious risk because drivers don’t expect to see you in the intersection.
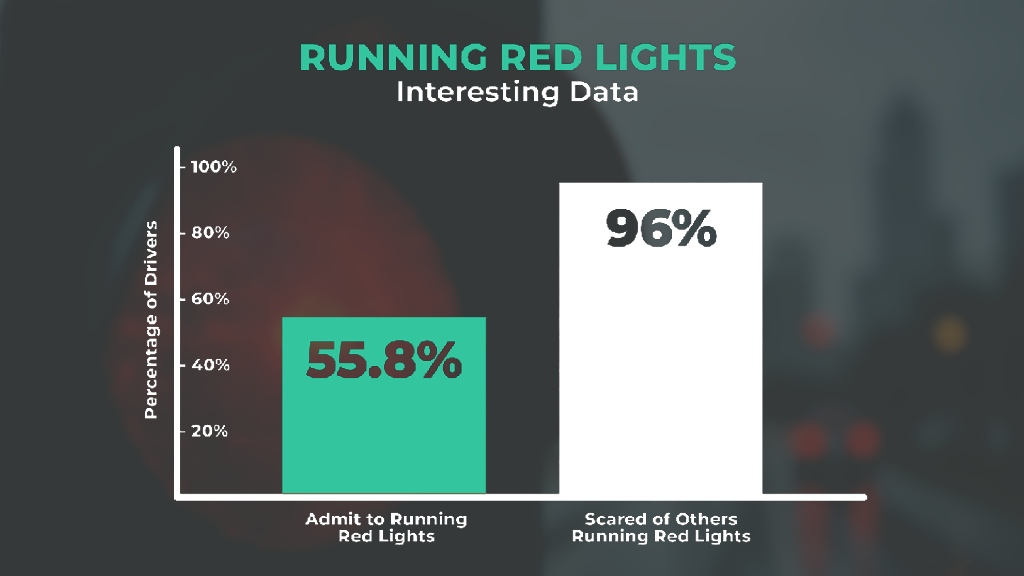
Surprisingly, over half of Americans admitted to running red lights. The scary part? 96% of drivers are afraid others will do the same.
Running Stop Signs
Stop signs are meant to control traffic flow and prevent chaos at intersections. But many drivers ignore them, especially when they don’t see other cars around.
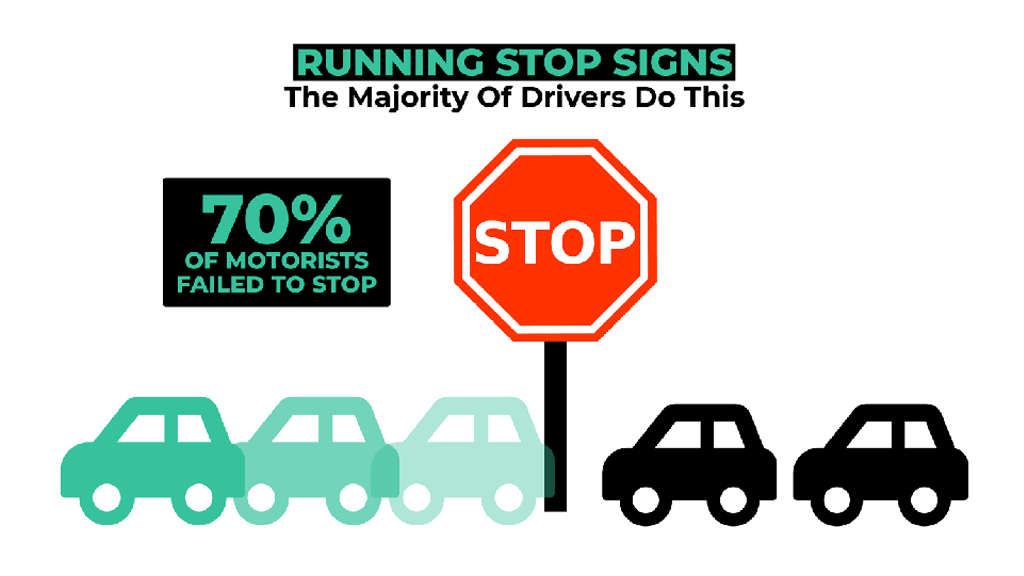
Around 70% of drivers skip stop signs if they think the road is clear. While it might seem harmless, you never know who’s coming, and running a stop sign can lead to fatal accidents.
Drunk Driving
Drunk driving is still a major problem. When you’re under the influence, it’s harder to control your vehicle and react to sudden dangers.
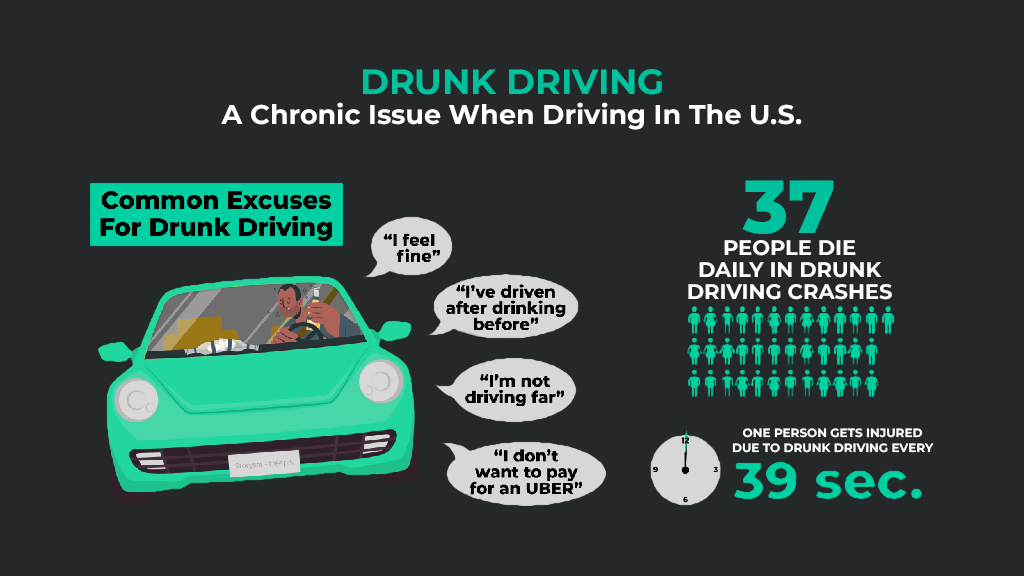
Every day, 37 people die in accidents involving drunk drivers, and another person is injured every 39 minutes. Despite campaigns against it, many still drive under the influence. Common excuses like “I feel fine” or “I’ve driven after drinking before” are dangerous.
Remember: It’s never safe to drink and drive. Even if you’re below the legal limit, it’s always better to avoid driving after drinking.
Poor Weather
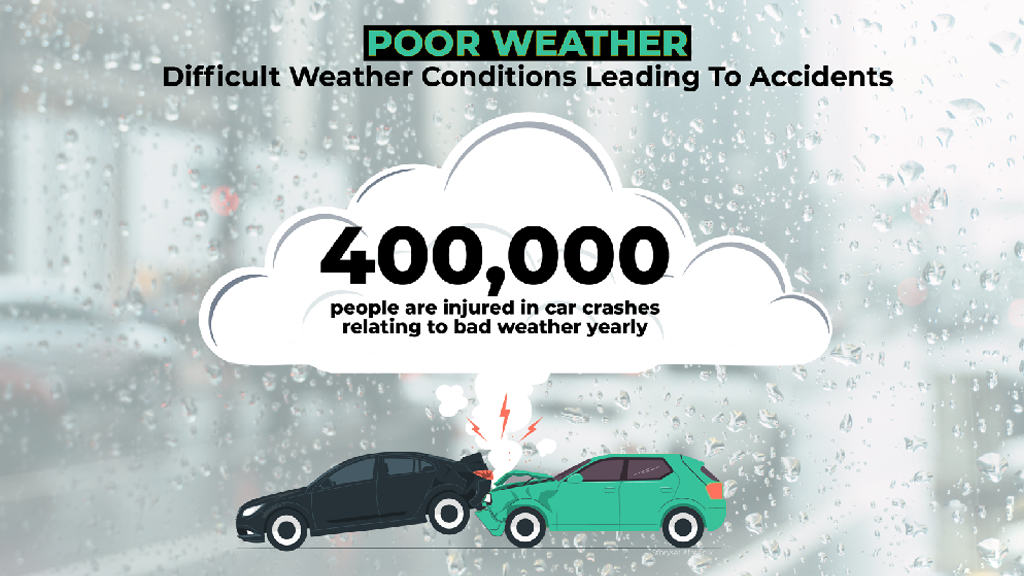
Bad weather can make driving much more dangerous. Snow, rain, and wind change the road conditions and require you to drive more carefully. Unfortunately, too many drivers treat bad weather like it’s a sunny day, leading to accidents from skidding, hydroplaning, and poor visibility.
Each year, over 418,000 people are injured in crashes related to bad weather. So, always check the weather before you head out and adjust your driving to stay safe.
Types of collisions: The impact on repair needs
What type of accidents result in the most damage? The answer might surprise you. Rear-end collisions account for about 30% of all accidents. This type of accident often results in significant bumper and rear-end repairs, which can mean steady business for you.
On the other hand, side-impact crashes (also known as t-bone accidents) are less common but tend to result in more severe damage, which can require more intensive repairs and even total car rebuilds.
The key takeaway here is that the type of accident can directly influence the type of repairs needed, allowing you to prepare your services for specific damage types.
The economic and global impact of road accidents
Road accidents are not just tragic—they also come with a staggering economic cost. In the U.S. alone, crashes drain up to $800 billion every year, and on a global scale, traffic accidents are expected to result in $1.8 trillion in economic losses between 2015 and 2030.
The human toll is just as alarming, with road accidents causing 1.35 million deaths worldwide annually. Shockingly, low- and middle-income countries experience the most fatalities, accounting for 93% of these fatalities, despite having only 60% of the world’s vehicles.
However, there’s hope for the future. Technologies like autonomous and shared transportation have the potential to cut global vehicle numbers by 25%, which could significantly reduce accidents and make our roads safer for everyone.
Conclusion
As auto repair shop owners, understanding these statistics can be incredibly useful in anticipating trends and preparing your business for the future. The number of accidents, the causes behind them, and the type of damage caused all play a role in shaping your shop’s workload. By tracking these trends, adjusting your strategies accordingly, and offering the services that are in high demand, you can set your business up for continued growth and success.
If you want to stay on top of these trends and provide the best possible service to your customers, knowing the latest accident statistics will help you stay ahead of the curve.


