



Average repair order (ARO) tells you how much revenue your shop makes per closed repair order. The number alone is not enough.
ARO can rise because customers are approving more needed work. Or because car count is falling. The solution is to capture more work identified through digital inspections. Maintain accurate pricing, follow-up, and complete repairs. Track ARO alongside car count and other shop KPIs to understand whether growth is sustainable.
What Is Average Repair Order Value — and How Do You Calculate It?
The ARO formula
Average repair order (ARO) is the average revenue generated for each closed repair order.
The formula is:
ARO = Total sales ÷ Number of closed repair orders.
A shop earns $84,000 in monthly sales across 140 closed repair orders. The ARO would be:
$84,000 ÷ 140 = $600 ARO
Some important points when calculating an accurate ARO:
- Use closed tickets. This means don’t use approved repair orders that have unfinished work remaining. This may distort numbers. This is why count only closed tickets, including small jobs.
- Calculate tax consistently. If you opt to include tax in sales for every period, then do so for all periods. Do not include it in one period and exclude it from other periods.
- Review ARO calculations. This helps auto shop owners identify changes. Compare prices and decide if prices need to be changed.
Split it — labor ARO vs. parts ARO
Calculate labor ARO and parts ARO separately. Below are some areas to focus on:
Scenario | What it means | Focus area |
Total ARO falls, labor ARO steady, parts ARO drops | Parts revenue is weakening | Investigate parts pricing, supplier cost changes and discounting habits. |
Both labor and parts ARO fall | Low-value or quick jobs have a higher ratio | Increase in major vs minor repairs. |
Labor ARO falls, parts ARO holds | Labor is underbilled or inefficient | Labor rates, billed hours, estimate conversion |
What industry data says about ARO benchmarks
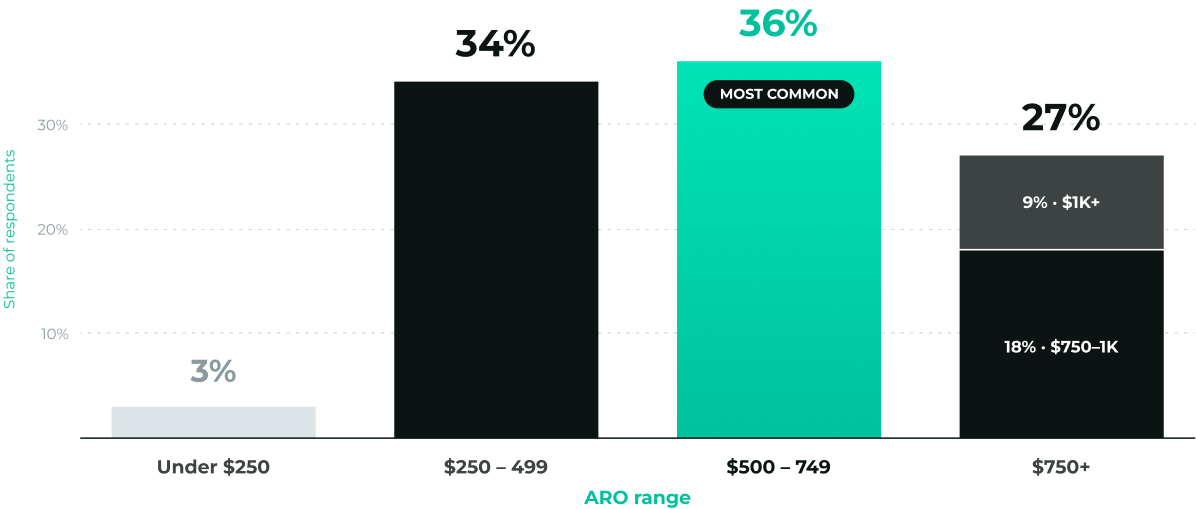
PartsTech’s 2025 survey of 752 U.S. repair shops found that 36% reported an ARO of $500–$749, while 34% reported $250–$499. PartsTech describes the report as providing “key trends, benchmarks, and free resources” for shop growth.

ARO Benchmark Distribution, PartsTech 2025
ARO Is a Capture Problem, Not a Selling Problem
Where the approved work is already sitting
Shop owners should see ARO as a capture metric. The focus is not on how much more the customer spends. But it is more about how the shop is identifying, presenting and capturing the work already available. This happens when technicians find more approvable repair jobs. However, they don’t become part of closed repair orders and hence understating ARO.
For example, a customer comes in for a brake service. The inspection further identifies $600 repair work on top of $150 brake service. The work approved is brake repair. So, ARO reflects $150 and loses out $600.
When a rising ARO is actually a warning sign
A high ARO is not always a good sign. The number needs to be tracked along with car counts. For an auto shop, ARO is rising, but car count remains the same or falls. This means the shop is losing small-ticket repeat customers.
It is a common mistake to enjoy rising ARO while ignoring outliers. In a 90-ticket month, one $6,000 transmission job adds about $67 to ARO ($6,000 ÷ 90), not $40. To avoid this, take a trimmed ARO by removing the top and bottom 5% of tickets. This helps separate one-off jobs from the underlying trend.
Inspect Every Vehicle, Every Visit — With Photos
Why photos change the approval decision
A customer can actually see photos with the help of digital vehicle inspection software. Technicians tell customers that their vehicle’s serpentine belt is cracked. How can the customer trust them? But when they see the photos, they know the condition needs repair. They can check and approve photo evidence rather than relying on verbal communication.
PartsTech’s 2025 report found that repair orders authorized digitally had an average value 50% higher than those without digital authorization.
Note: PartsTech’s 2025 benchmark data is based on U.S. repair shops. Canadian shop owners can use it as a general guide, but ARO can vary by province, labor rates, and local market conditions.
The three-tier presentation framework
Break down the inspection into three parts:
- Unsafe now: Cracked belt that can fail and is prone to accidents if not repaired immediately.
- Needed soon: Brake pads need service soon.
- Watch it: Minor tire wear that doesn’t require immediate replacement.
It is a common mistake to tell customers all three parts at the counter verbally. Instead, send them photos of the digital vehicle inspection with written notes under each. The customer can see what needs immediate action, what can wait and what simply needs monitoring.
Follow Up on Declined Work Every Time the Vehicle Returns
What the declined list contains and why it matters
It might happen that customers do not approve certain repair work. These are mostly watch it or needed repairs soon. Keep a record of this declined work from customers.
The declined repair list can become a source of ARO recovery. When the customer returns with the vehicle, check the declined list first. See what they declined and why. Include the declined repair list in the current findings and remind customers why it’s time to get these repairs done.
The follow-up workflow
A customer declined a rear brake repair six months ago. They return the vehicle, run 2,000 miles more and need an oil change. The technician checks previous history and recommends:
“Your rear brakes were recommended at your last visit. They’re still due based on today’s inspection.”
Treating every visit as a blank slate can mean missing the second or third opportunity to complete recommended work. Also, relying on memory or asking the customer about the last recommendations can further lose revenue.
This is why, use shop management software. It can store inspection findings and recommendations against the vehicle record/VIN. This makes the history available at every visit.
Declined Work Follow-Up Workflow





Bundle Services and Complete Approved Work on the Same Visit
Service packages that increase per-ticket value
Service packages are when complementary repairs are bundled into packages. Bundling makes it easier to understand, get approved by customers and raise per-visit ARO.
Service package | What it includes |
Brake Service | Pads, rotors, and fluid flush |
Seasonal Check | Oil change, tire rotation, and inspection |
Fluid Maintenance | Cooling, transmission, and power-steering service |
A customer comes in for an oil change service. The technician finds a due tire rotation and cabin air filter during a maintenance check. The advisor presents all three services in one maintenance package rather than quoting three separate repairs. The customer needs to make one decision.
The cost of splitting an approved job across visits
It is a common mistake to complete part of an approved repair. This is to keep today’s ticket smaller. Instead, if the customer has approved and parts are available, then complete the repair in the same visit. Splitting the repair tasks can lower one day’s ARO but would increase costs of scheduling and coordination on next visits.
Price Accurately — Parts, Labor, and Diagnostic Time
Parts markup consistency
It is good to set parts markup based on the parts costs. This keeps margin consistent across tickets. If not followed, then advisors can uncharge for expensive parts or charge different amounts for similar jobs. This can lead to reduced ARO.
Billing diagnostic time
Diagnostic charges may be waived from the invoice amount. This can reduce labor ARO on every diagnostic ticket.
Diagnostic work is billable hours. It includes technician’s time, expertise and equipment. This is why include diagnostic labor on the estimate and invoice, even for approved repairs.
Reviewing the labor rate
Auto shops do not change labor rates for years. On the other hand, technicians’ rent and operating costs keep on rising. Labor rates should match the value and time invested.
It is important to maintain and review review labor rates against other local shops at least once a year.
For example, if similar shops charge $145/hour while your shop bills $125, increasing your rate by $10 across 140 monthly ROs adds $1,400 in monthly labor revenue at the same volume.
Train Advisors to Educate Customers — Not to Sell Them
What customers respond to vs. what advisors default to
Customers need to understand the repair process rather than seeing a list of repair jobs to be done. The service advisor shouldn’t just say, ‘The air engine needs replacement ’.
They should follow the auto repair customer communication process. They need to explain why the replacement is required. Explain to the customer that a restricted filter can reduce proper engine airflow. Then, give the customer the right to decide whether they want to repair or monitor it now.
Preventive maintenance conversations
Advisors avoid maintenance recommendations because they fear customers will decline. Air filters, shocks, and fluid flushes are among the services commonly declined at independent shops.
This advisor assumption can already reduce ARO before customers can even decide. Present the recommendation clearly, explain why it matters, and let the customer choose.
For example: “Your air filter is dirty. It isn’t an emergency, but replacing it now helps maintain proper airflow. Would you like us to take care of it today?”
Financing options for high-ticket authorisations
Customers can become hesitant to approve a large repair amount. This is why service advisors can provide financing options at the time of sending estimates. A deferred suspension is quoted at $1,800. When the shop offers monthly payment options with the estimate, the customer may authorize repair instead of postponing it.
Track ARO Alongside Car Count — Always
What the combination of both numbers actually reveals
ARO shows how much each repair order is worth. Car count tells how many customers are coming to the shop. Combining these two shop performance KPIs tell if the shop’s growth is steady and healthy.
For example, ARO rises from $600 to $700. But the monthly car count stays at 140. That is an improvement. If ARO reaches $700 and car count falls from 140 to 110. Then investigate: the shop may be losing small-ticket repeat customers who provide future repair opportunities.
KPIs that belong next to ARO on the same dashboard
Track these alongside ARO:
- Inspection capture rate: findings presented vs. authorised.
- Declined-work conversion: previously declined work later approved.
- Effective labor rate: actual labor revenue per billed hour.
- Technician efficiency: billed hours compared with available hours.
These shop reporting and KPIs together explain why ARO moved instead of leaving you with a number but no cause.