Owning a car is a big goal in anyone’s life, right? It’s one of the biggest purchases you can make. And car ownership continues to trend up. Between 2017 and 2021, vehicle registrations increased by 3.66%.
But with rising inflation, fuel costs, and an increasing number of people working from home, do you think people will continue buying cars? Let’s check what the numbers say.
Starting at the macro level, we review how many cars are owned in the United States. We then break down the numbers by state, city, and the average American household. Let’s go!
Unlock powerful tools to manage your shop. Get the full AutoLeap experience today.
How many cars are in the United States?
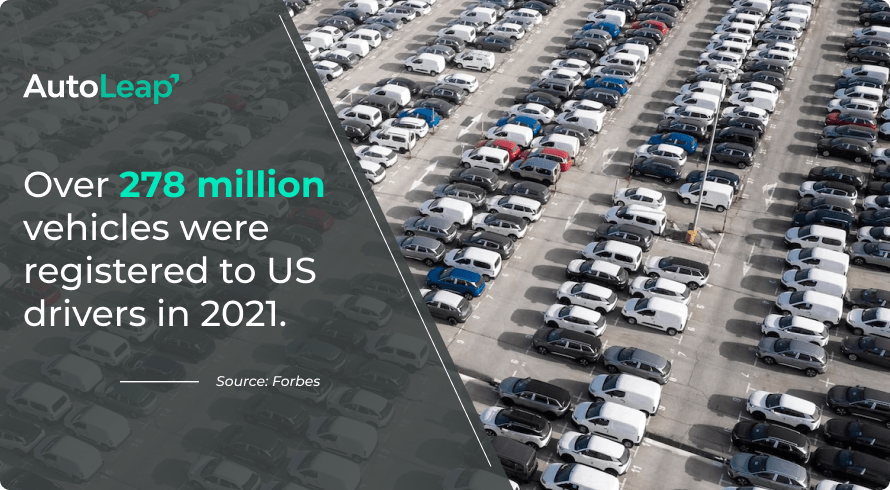
According to Forbes, there were a total of 278,063,737 vehicles registered to US drivers in 2021. That figure includes cars for personal and commercial use.
Between 2014 and 2021, there was a 6.8% increase in the number of cars registered to drivers. This spike is a clear indicator of how many Americans value car ownership.
Of the total number of vehicles owned nationally, 4,088,696 were publicly-owned cars. The rest were private or commercially owned vehicles.
In 2019, 8.7% of Americans (roughly 28 million people) didn’t have vehicle access. This percentage went down by 2021 to 8.3%. That means a whopping 91.7% of households owned at least one car in 2021! This is yet another indicator of an increase in US car ownership.
What state has the most registered cars?
In 2021, California had the highest number of registered motor vehicles overall (over 31 million). Not just that, The Golden State also had the most number of motor vehicle registrations in 2021 (about 14.3 million).
California has held that top spot for the past few years. In 2019 it was also the state with the highest number of registered cars. It isn’t surprising since California is the highest populated state in the US. Almost 98% of the vehicles are used for private or commercial use.
The two states that trail slightly behind California are Texas and Florida. Texas has over 22 million registered vehicles, while Florida has over 18 million registered vehicles.
On the other hand, less populated states in the country like Vermont have the lowest number of registered vehicles. Even in 2019, Vermont had the lowest number of registrations, with only 620,428 registered vehicles. Alaska fits into this category as well due to its low population density.
However, even when owning a car has many benefits, it is not convenient or cost-effective in every state in the United States. Some cities might have the best public transport systems or the worst parking facilities. Hence it might make sense to forgo car ownership altogether. For instance, Washington D.C., and New York have the highest number of people without a vehicle.
It’s also interesting to observe which state increased its motor vehicle registrations. Between 2017 and 2021, Delaware (49.55%) had the highest increase in motor vehicle registrations, followed by Maine (28.09%), Arkansas (25.08%), Utah (19.99%), and Montana (18.18%).
However, The District of Columbia had the largest decrease in motor vehicle registrations during the same period, with a big drop of 65%. This was followed by West Virginia (27.42%), Alaska (13.98%), New York (13.27%), and North Dakota (12.87%).
This brings us to our analysis by city. Which city has the most number of cars and which has the fewest?
Which city in the US has the most cars?
The city you live in determines whether you want to own a car or whether you can get by without one. Outside of any US metropolitan area, car ownership becomes a necessity. Having a vehicle helps with commuting to work, dropping kids at school, and running errands.
Here are the top five US metropolitan areas that have the highest percentage of vehicle ownership:
- Daphne-Fairhope-Foley, AL
- Provo-Orem, UT
- Greeley, CO
- Twin Falls, ID
- St. George, UT
Each area has 96%+ of households that own a vehicle. On the other hand, we have cities like New York, Newark, and Jersey City with the lowest percentage of households with vehicles. And just behind these metropolitan areas are Philadelphia, San Francisco, and Boston.
How many Americans own a car?
Now let’s look at how many Americans own a car at the individual and household level. The data suggests that the number of people who own a car increased significantly. As mentioned above, a 6.8% increase in the cars registered to drivers occurred between 2014 and 2021.
Studies suggest the number of households with three or more vehicles is rising. In 2021, almost 22% of households owned 3+ cars.
And you know which state is most likely to have 3+ vehicles per resident? Wyoming residents (33.5%)! This is followed by Utah residents (32.3%).
As cited by the research, a possible explanation is that the average American household is growing. Because of this, they own more cars. The research also suggests that the average American household income went up, resulting in a rise in the number of cars per household.
What are the most popular vehicles in the US?
Do you know which vehicles are the most popular among Americans? According to Forbes, Ford F-Series takes the crown for the most popular and sought-after vehicle across the United States. Ford sold 653,957 F-Series pickup trucks in 2022.
Here are the next four vehicles on the list:
While these models might be the most popular cars among Americans, the list of car manufacturers with the highest brand value looks slightly different. Topping the list is none other than Tesla. And the top four brands following Tesla include:
- Toyota
- Mercedes-Benz
- BMW
- Ford
What’s interesting to note here is that while Ford is one of the most popular manufacturers among Americans, it stands at number five in terms of brand value.
Cost of car ownership in the US
Owning a car not only opens up a world of opportunities, but it’s also a right of passage and signifies success and accomplishment. Having your car helps with commuting to work and school. It’s also useful in cases of emergency. Even with rising costs, owning a car offers plenty of value. That is why we still see a rising number of car purchases.
However, car ownership also comes with extra expenses that car owners can underestimate. Regular maintenance, fuel costs and insurance are all major expenses that can vary in magnitude by state.
Before we dive into the actual numbers, let’s consider some of the major costs involved in owning a car:
- Car insurance
- Car maintenance
- Car fuel
According to AAA, it takes about $10,000 to keep, operate and maintain a car. That’s a big amount! With rising inflation, this cost has gone up by 11% in comparison to 2021.
These costs have gradually increased over the years and are expected to rise soon. This is all thanks to labor costs and supply chain issues. Let’s not forget the rising cost of spare parts and the labor that works on your cars. All these factors contribute to the rising cost of US car ownership.
And now what about buying a car? Let’s see what that data looks like.
How much does buying a car cost?
During the pandemic shutdown, there was an almost 30% increase in the price of new vehicle transactions. In 2022, the price of an average new vehicle transaction was still around $45,000!
In comparison, the price of a used car has increased by about 50%, with an average sale price of above $30,000 in 2022.
This gives you a clear picture of all the costs involved from purchase and the year-on-year recurring costs.
Cost of keeping a car by state
The cost of keeping a car varies by state and by city. It’s the most expensive to keep a car in California and Nevada. Those states get followed by Colorado, Florida, and Alaska. However, the least expensive states to own a car are Ohio, Iowa, Wisconsin, Maine, and New Hampshire.
When it comes to car repairs, Connecticut is the most expensive. It costs over $400 for an average check-engine light repair. New York has the most expensive annual car insurance ($4700+).
Iowa and Ohio have low costs of keeping a car because car insurance costs are low in those states. Hence, depending on the state you live in, your cost of keeping and maintaining a car can be more than the previously stated amount of $10,000.
Additional trends from 2022
Let’s round up a few extra statistics for you on operating vehicles, courtesy of Statista.
- Drivers with incomes between $50,000 – $75,000 have around 33% of the cars used in the US today.
- The average age of a vehicle is 12.
- Between 2021 and 2022, 40 million used cars had new owners, whereas new registrations were about 13 million.
- Gen Z is the generation of most active drivers today.
Why you should know these stats as a shop owner

» Looking to transform your shop? Discover how our software for auto repair shop can help.
Closing thoughts
We hope these car ownership stats and auto repair insights help you take your shop to the next level!
There isn’t one right answer! But when working on minor service like oil changes, nitrile disposable gloves are a mechanic’s best friend. When it comes to more in-depth work, you will want to use thicker multi-use gloves.
Both latex and vinyl offer good protection against brake fluids, but nitrile offers excellent resistance.
Nitrile disposable gloves are the go-to choice for mechanics due to the polymer’s abrasive properties, excellent puncture resistance, and grip in oily environments.